Author: edemir

  • BH-Pools/Watertanks Datasets

    BH-Pools/Watertanks Datasets

    BH-POOLS & BH-WATERTANKS

    Two separate datasets were assembled: BH-Pools and BH-WaterTanks, with annotated swimming pools and water tanks respectively. Both datasets consist of imagery from several neighbourhoods in the city of Belo Horizonte, Minas Gerais, Brazil. The data was acquired through the Google Earth Pro tool. The images were exported from an eye altitude of 330 meters with a resolution of 3840×2160 (4K), and the image bands are the three visible ones: red, green and blue. For each occurrence of the target objects found on the images, a polygon was drawn in order to generate the segmentation masks of the instance.

    The BH-Pools dataset consists of 200 4K images of 8 different neighbourhoods (25 images for each one) and contains 3980 annotated pools. The BH-WaterTanks dataset is made up of 150 4K images of 6 neighbourhoods (25 images for each one) and contains 16216 annotated water tanks.

    [siteorigin_widget class=”SiteOrigin_Widget_Image_Widget”][/siteorigin_widget]

    Download Dataset/Code

    [siteorigin_widget class=”SiteOrigin_Widget_Button_Widget”][/siteorigin_widget]
  • Multi-View Datasets

    Multi-View Datasets

    AiRound

    AiRound is composed of 11,753 images distributed among 11 classes, including: airport, bridge, church, forest, lake, river, skyscraper, stadium, statue, tower, and urban park.
    Each sample is composed by a triplet, that contains images in 3 distinct points of view: (i) a ground perspective image; (ii) a high resolution RGB aerial image; and (iii) a multi-spectral image taken from the Sentinel-2 satellite.
    All images are paired and were manually checked to guarantee their correctness.

    [siteorigin_widget class=”SiteOrigin_Widget_Image_Widget”][/siteorigin_widget]

    CV-BrCT

    CV-BrCT is composed of 24K pairs of images, each one containing a street-level scene and a high-resolution aerial image. Those samples are labeled in 8 different classes, which includes apartment, hospital, house, industrial, parking lot, religious, school, store, and vacant lot.

    [siteorigin_widget class=”SiteOrigin_Widget_Image_Widget”][/siteorigin_widget]

    Download Dataset/Code

    [siteorigin_widget class=”SiteOrigin_Widget_Button_Widget”][/siteorigin_widget]
    [siteorigin_widget class=”SiteOrigin_Widget_Button_Widget”][/siteorigin_widget]
    [siteorigin_widget class=”SiteOrigin_Widget_Button_Widget”][/siteorigin_widget]
  • BrazilDam Dataset

    BrazilDam Dataset

     BrazilDAM Dataset

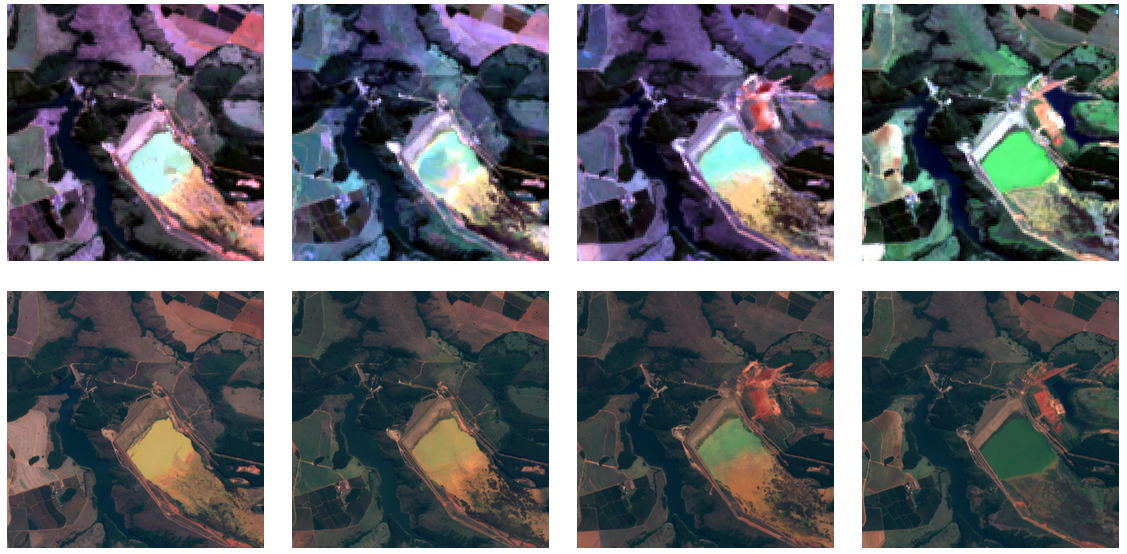
    BrazilDAM is a multi sensor and multitemporal dataset that consists of multispectral images of ore tailings dams throughout Brazil. Landsat 8 and Sentinel 2 satellites that capture multispectral images over the years 2016, 2017, 2018 and 2019 were used. The dataset contains samples collected in different regions, which increases the diversity and representativeness of the characteristics of the dams.


    Coordinates data came from the Brazilian National Mining Agency that’s made available on its website a georeferenced database describing all officially registered tailings dams in the country. The database contains some identification information about the dams and their owners and spatial coordinates of a point indicating each dam’s location. There is also some technical information like the main ore, height, volume, constructive method, risk category, potential damage associated with the dam.

    [siteorigin_widget class=”WP_Widget_Media_Image”][/siteorigin_widget]

    2016

    2017

    2018

    2019

    LANDSAT
    [siteorigin_widget class=”SiteOrigin_Widget_Image_Widget”][/siteorigin_widget]
    [siteorigin_widget class=”SiteOrigin_Widget_Image_Widget”][/siteorigin_widget]
    [siteorigin_widget class=”SiteOrigin_Widget_Image_Widget”][/siteorigin_widget]
    [siteorigin_widget class=”SiteOrigin_Widget_Image_Widget”][/siteorigin_widget]
    SENTINEL
    [siteorigin_widget class=”SiteOrigin_Widget_Image_Widget”][/siteorigin_widget]
    [siteorigin_widget class=”SiteOrigin_Widget_Image_Widget”][/siteorigin_widget]
    [siteorigin_widget class=”SiteOrigin_Widget_Image_Widget”][/siteorigin_widget]
    [siteorigin_widget class=”SiteOrigin_Widget_Image_Widget”][/siteorigin_widget]

    Statistics

    Results of methods and tools evaluated against the RCPD dataset:

    Satellite Landsat 8 Sentinel 2
    Year Dam Not Dam Dam Not Dam
    2016 761 1143 769 1156
    2017 769 1155 769 1156
    2018 769 1156 769 1156
    2019 756 1130 769 1156

    Citation

    The dataset is described in the paper BrazilDAM: A Benchmark dataset for Tailings Dam Detection

    If you mention the BrazilDAM dataset, please use the following reference:

     
    @inproceedings{
      ferreira2020brazildam,
      title={BrazilDAM: A Benchmark dataset for Tailings Dam Detection},
      author={Ferreira, E., Brito, M., Alvim, M. S., Balaniuk, R., dos Santos, J.},
      booktitle={Latin American GRSS & ISPRS Remote Sensing Conference 2020, Santigo, Chile},
      year={2020},
      organization={IEEE}
    }
    

    Download Dataset/Code

    [siteorigin_widget class=”SiteOrigin_Widget_Button_Widget”][/siteorigin_widget]
    [siteorigin_widget class=”SiteOrigin_Widget_Button_Widget”][/siteorigin_widget]
  • Fashion Dataset

    Fashion Dataset

    Fashion Dataset

    This dataset is a composition of fashion images and associated tags and comments crawled from two fashion-related social networks, namely pose.com and chictopia.com. The first part of this dataset (related to the pose.com website) was crawled from January 15, 2014 to January 25, 2014, resulting in more than two thousand instances. Now, the second part of this dataset (related to the chictopia.com website) was crawled from January 25, 2014 to February 5, 2014, resulting in almost two thousand samples. At the end, the whole dataset is composed of approximately four thousands images and associated tags and comments.

    Statistics

    As mentioned, the whole dataset has approximately four thousands instances.
    Combining labels from both websites results in a set of 31 class possibilities: “bag”, “bathing suit”, “belt”, “booties”, “cape”, “coat”, “dress”, “glass”, “gloves”, “hat”, “headband”, “jacket”, “jewelry”, “jumpsuit”, “pants”, “pumps”, “sandals”, “scarf”, “shirt”, “shoes”, “shorts”, “skirt”, “sneakers”, “socks”, “suit”, “sweater”, “tights”, “umbrella”, “underwear”, “vest” and “wallet”. Images crawled from pose.com have 620×620 pixels while the ones crawled from chictopia.com have 400×600 pixels.

    More statistics about the dataset next:

    Statistic pose.com chictopia.com
    Number of photos 2,306 1,579
    Number of tags 7,501 5,093
    Number of comments 27,486 12,348
    Tags per photo 3.25 3.23
    Comments per photo 11.92 7.82

    Please, cite this dataset as:

    pdf-icon
    Nogueira, Keiller, Adriano Alonso Veloso, and Jefersson Alex Dos Santos. “Pointwise and pairwise clothing annotation: combining features from social media.” Multimedia Tools and Applications 75.7 (2016): 4083-4113.


    pdf-icon
    Veloso, Adriano Alonso, Jefersson A. dos Santos, and Keiller Nogueira. “Learning to annotate clothes in everyday photos: multi-modal, multi-label, multi-instance approach.” 2014 27th SIBGRAPI Conference on Graphics, Patterns and Images. IEEE, 2014.


    @article{nogueira2016pointwise,
    	title={Pointwise and pairwise clothing annotation: combining features from social media},
    	author={Nogueira, Keiller and Veloso, Adriano Alonso and Dos Santos, Jefersson Alex},
    	journal={Multimedia Tools and Applications},
    	volume={75},
    	number={7},
    	pages={4083--4113},
    	year={2016},
    	publisher={Springer}
    }
    
    @inproceedings{veloso2014learning,
    	title={Learning to annotate clothes in everyday photos: multi-modal, multi-label, multi-instance approach},
    	author={Veloso, Adriano Alonso and dos Santos, Jefersson A and Nogueira, Keiller},
    	booktitle={2014 27th SIBGRAPI Conference on Graphics, Patterns and Images},
    	pages={327--334},
    	year={2014},
    	organization={IEEE}
    }


  • Region-based Annotated Child Pornography Dataset

    Region-based Annotated Child Pornography Dataset

    Region-based Annotated Child Pornography Dataset (RCPD)

    This dataset is a private database that belongs to the Brazilian Federal Police. The paper “A Benchmark Methodology for Child Pornography Detection” describes the structure of the dataset. The aim of the dataset is to assess and compare the performance of child pornography detection methods. Its files are not available to the public by any means, but researchers can submit their child pornography detection methods to be evaluated against the RCPD dataset following the instructions below.

    Evaluation Instructions

    To submit your method, you should send an email to macedo.jjmn@dpf.gov.br with a zip file containing your method and a script for a docker container, defining libraries and dependencies. Alternatively, you can email a link for these files. You should also implement the code to test your method, with the following requirements:

    • assume that the images are located in a folder named “data”, under your method’s directory
    • output a csv file named results.txt, containing the name of each tested image and your prediction (‘True’ or ‘False’) for child pornography:
    
    filename001.jpg,True
    filename002.jpg,False
    filename003.jpg,False
        

    The following script shows an example of this code in Python:

    
    import os
    import random
    from os.path import abspath, dirname, isfile, join
    
    # predicts whether an image is related to child pornography
    # returns True or False
    def predict(file_path):
        #call your method here
        return random.choice([True, False])
    
    if __name__== "__main__":
        script_dir = dirname(abspath(__file__))
        dset = join(script_dir, "data")
        results = join(script_dir, "results.txt")
        output = open(results, "w")
        fnames = [f for f in os.listdir(dset) if isfile(join(dset, f))]
        for f in fnames:
            res = predict(join(dset, f))
            output.write(f + "," + str(res) + "\n")
        output.close()
        

    Scoreboard

    Results of methods and tools evaluated against the RCPD dataset:

    Method/Tool Accuracy (%) Precision (%) Recall (%) F1-Score (%)
    Macedo et al. 79.84 68.64 64.61 66.56
    LED 76.47 75.34 57.21 66.30
    NuDetective 57.43 78.74 41.24 54.13

    Please, cite this dataset as:

    pdf-icon
    Macedo, Joao, Filipe Costa, and Jefersson A. dos Santos. “A Benchmark Methodology for Child Pornography Detection.” 2018 31st IEEE SIBGRAPI Conference on Graphics, Patterns and Images (SIBGRAPI). 2018.
    
    @inproceedings{
      macedo2018rcpd,
      title={A Benchmark Methodology for Child Pornography Detection},
      author={J. Macedo, F. Costa and J. A. dos Santos},
      booktitle={Graphics, Patterns and Images (SIBGRAPI), 2018 31th SIBGRAPI Conference on},
      year={2018},
      organization={IEEE}
    }